Providence Health Care (PHC).2024
Resource Planning for PHC
PHC, a healthcare leader in British Columbia, used machine learning to tackle staffing challenges during COVID-19 by forecasting workforce needs 18 months ahead.
I supported the project through research, data analysis, and helping refine and implement the forecasting model.
Deliverable
- Project Report
- PowerPoint Presentation
- Project Charter
- Gantt Chart
- Python Code
(SARIMA & Prophet Models)
- CSV for Prediction Results
- PowerPoint Presentation
- Project Charter
- Gantt Chart
- Python Code
(SARIMA & Prophet Models)
- CSV for Prediction Results
Team
4 members
Duration
10 weeks
tool
- Excel
- Python
- Python
The findings and data analysis align closely with our internal insights, validating the accuracy and reliability of the results.

Key Findings
Prophet wins on accuracy
Outperformed SARIMA by handling seasonality and non-linear trends with ease—plus, it’s simple to implement.
Troubling trends ahead
Expect fewer productive hours and more sick leave this winter, with overtime and job vacancies continuing to rise.
Action needed
These gaps call for smarter staffing strategies to boost engagement and cut overtime costs.
Room to grow
More data, smarter tuning, and exploring ensemble models.
Ready to roll
A phased integration plan is in place—complete with change management and training to bring predictive planning into daily ops.
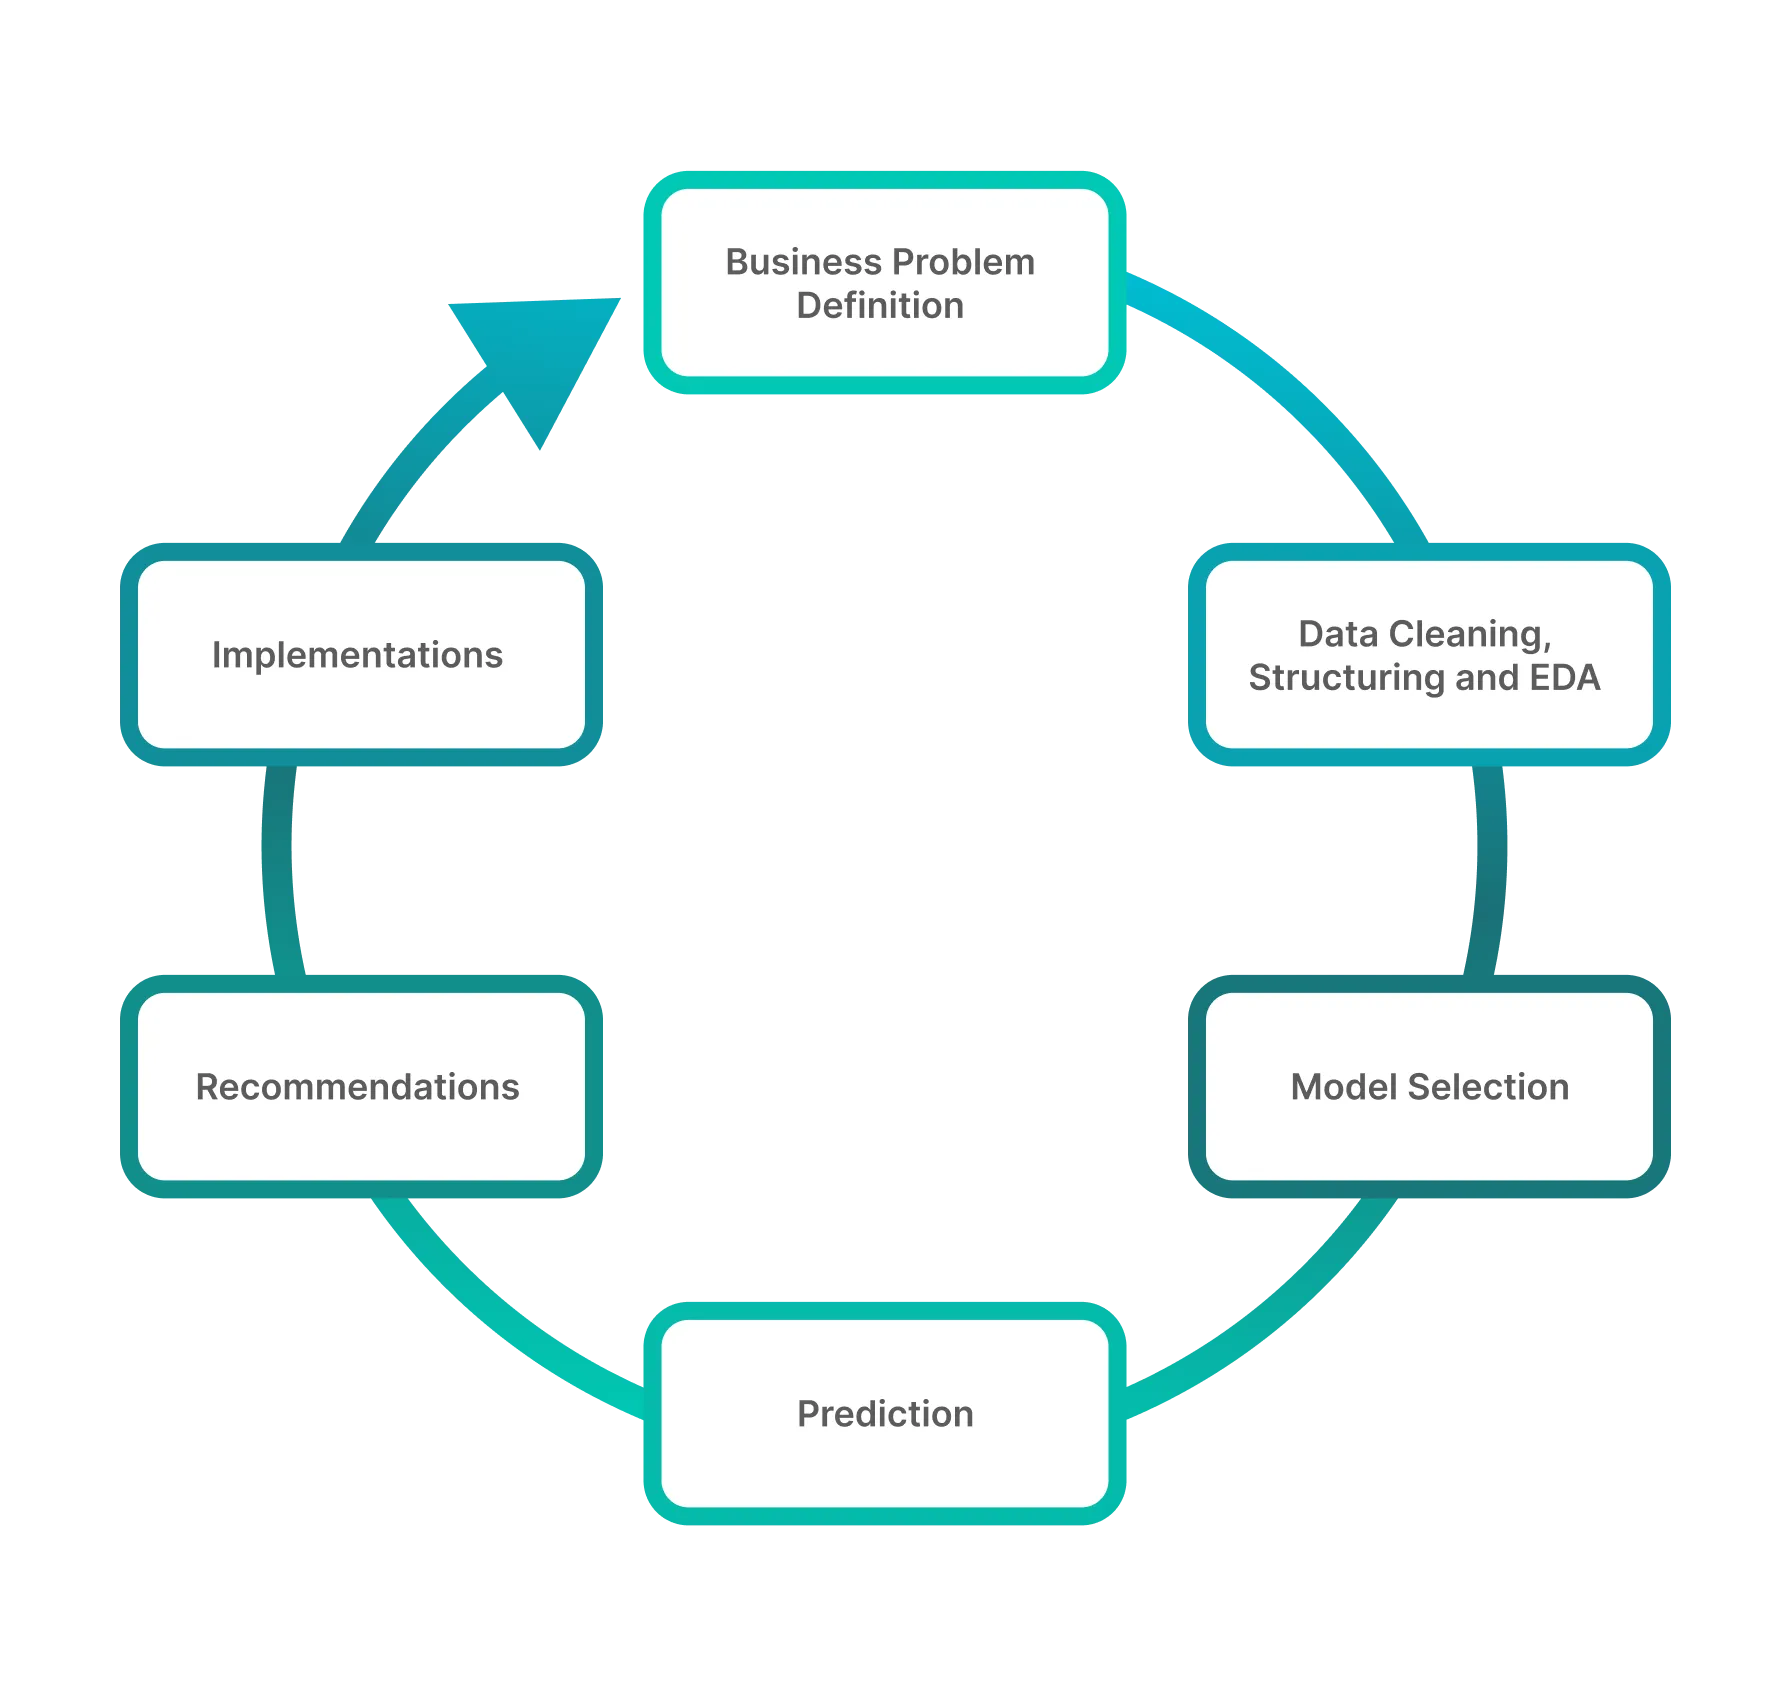
Methodology
We followed the machine learning cycle, covering:
- Data cleaning & grouping
- Exploratory Data Analysis (EDA)
- Model building, training & testing
Data Preparation
1. Data
Monthly data of 6 metrics (listed below) collected from 38 units from March 2014 to February 2024 was provided by PHC.
| Metric | Description |
|---|---|
| Headcount | Current staff numbers |
| Overtime | Hours worked beyond regular shifts |
| Sick Time | Hours taken for sick leave |
| Vacancies | Open positions |
| Turnover | Employee departures |
| Productive Hours | Total working hours |
2. Grouping
After looking into the data, 38 units has been grouped into 10 service groups as listed below according to their function and similar trends if existed. The model building and prediction is based on the 10 different service groups and the aggregated overall value for each metrics.
| Group no. | Service Group |
|---|---|
| 1 | Emergency and Critical Care |
| 2 | GI Clinic |
| 3 | Heart Services |
| 4 | Kidney Care |
| 5 | Maternity and Neonatal Care |
| 6 | Palliative Care |
| 7 | Medical Unit |
| 8 | Surgical Unit |
| 9 | Specialty Clinic |
| 10 | Others |
3. Study Assumptions
- Zero is assumed for missing records; data is aggregated monthly or captured as a month-end snapshot.
- Small departments and projects are excluded.
- All staff members are assumed to be full-time (7.5 hours/day), with no internal workforce transfers during the period.
- Data for all metrics is spread evenly or remains constant throughout the month.
- Throughout the period, no major restructuring or external changes occurred.

4. Study Limitations
Limited Historical Data & COVID Disruptions
- Incomplete pre-pandemic data impacts long-term forecast accuracy.
- COVID-19 and temporary units introduced irregularities, making trends harder to model.
Aggregation Reduces Precision
- Service group roll-ups dilute unique unit-level trends.
- Structural changes (e.g. merging/splitting units) aren’t fully captured.
- Snapshot data lacks key assumptions, affecting headcount and vacancy accuracy.
Narrow Model Scope
- Only six HR metrics are included, limiting forecasting depth.
- External factors like labor trends, patient volume, and economic shifts are excluded.
- Assumes workforce stability, overlooking seasonal changes and training cycles.
Missing External & Contextual Variables
- Policy shifts, staffing models, and market conditions are not factored in.
- Seasonal turnover and post-training staff movements aren’t reflected.
Exploratory Data Analysis
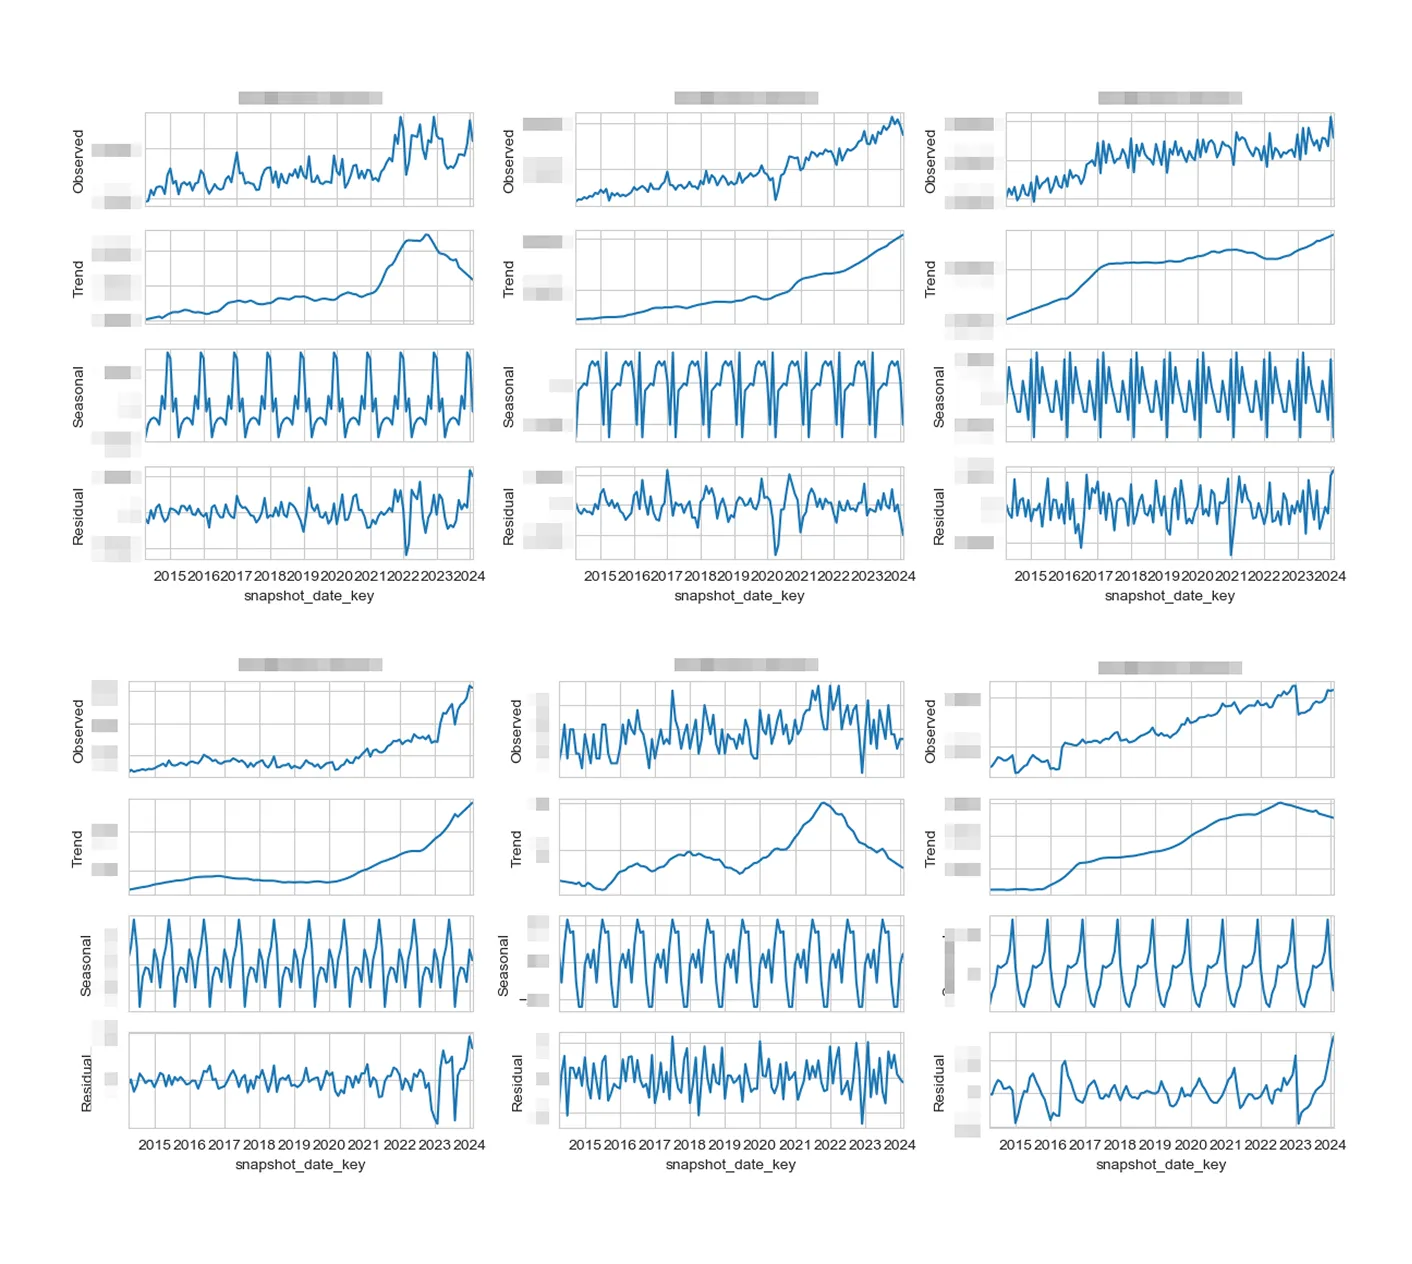
Overall Trends
We aggregated unit-level data to analyze PHC’s workforce metrics at a system-wide level.
After applying seasonal decomposition, each metric revealed distinct trend and seasonality patterns, highlighting the complexity of forecasting across services.
After applying seasonal decomposition, each metric revealed distinct trend and seasonality patterns, highlighting the complexity of forecasting across services.
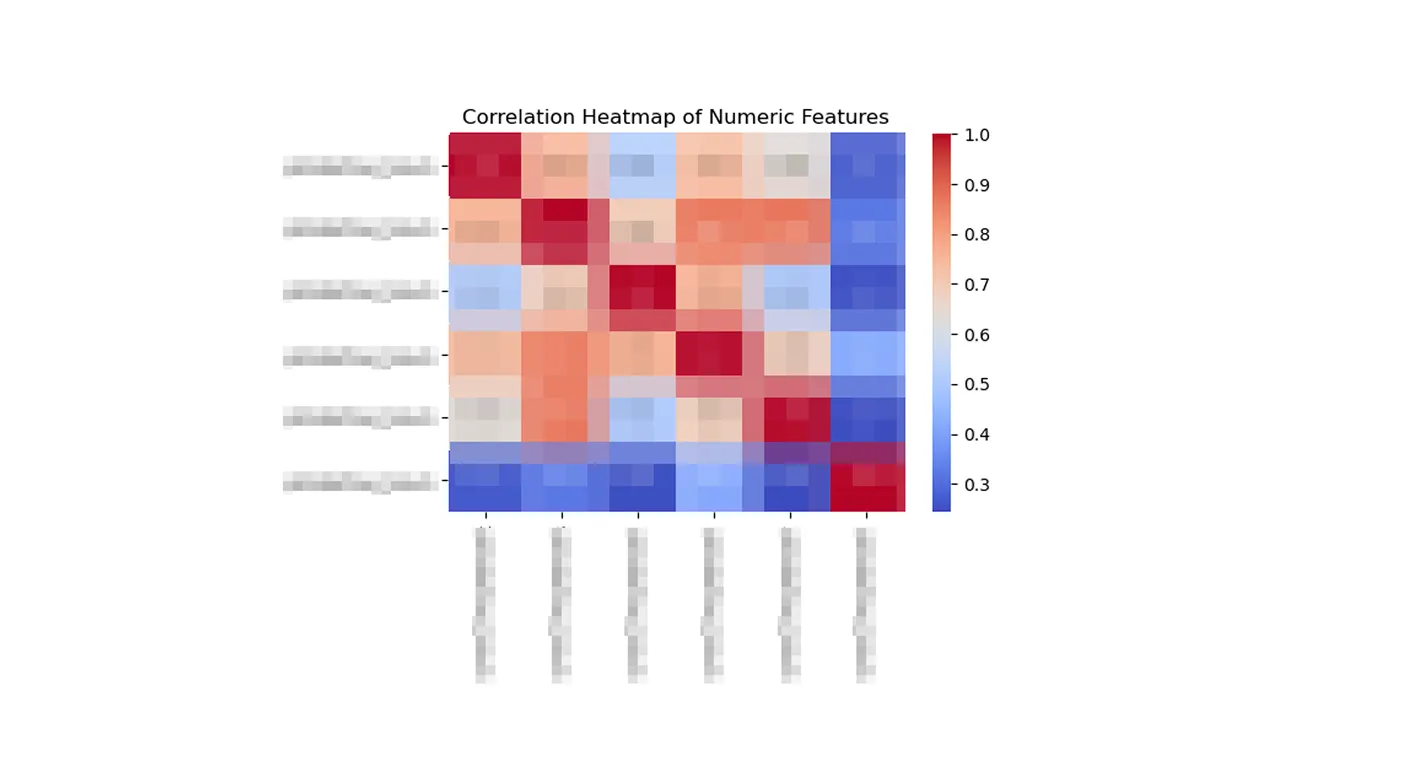
Correlation Insights
We identified key relationships between workforce metrics—some strongly linked, others loosely connected.
These insights helped us prioritize impactful variables, improving model performance through smarter feature selection.
These insights helped us prioritize impactful variables, improving model performance through smarter feature selection.
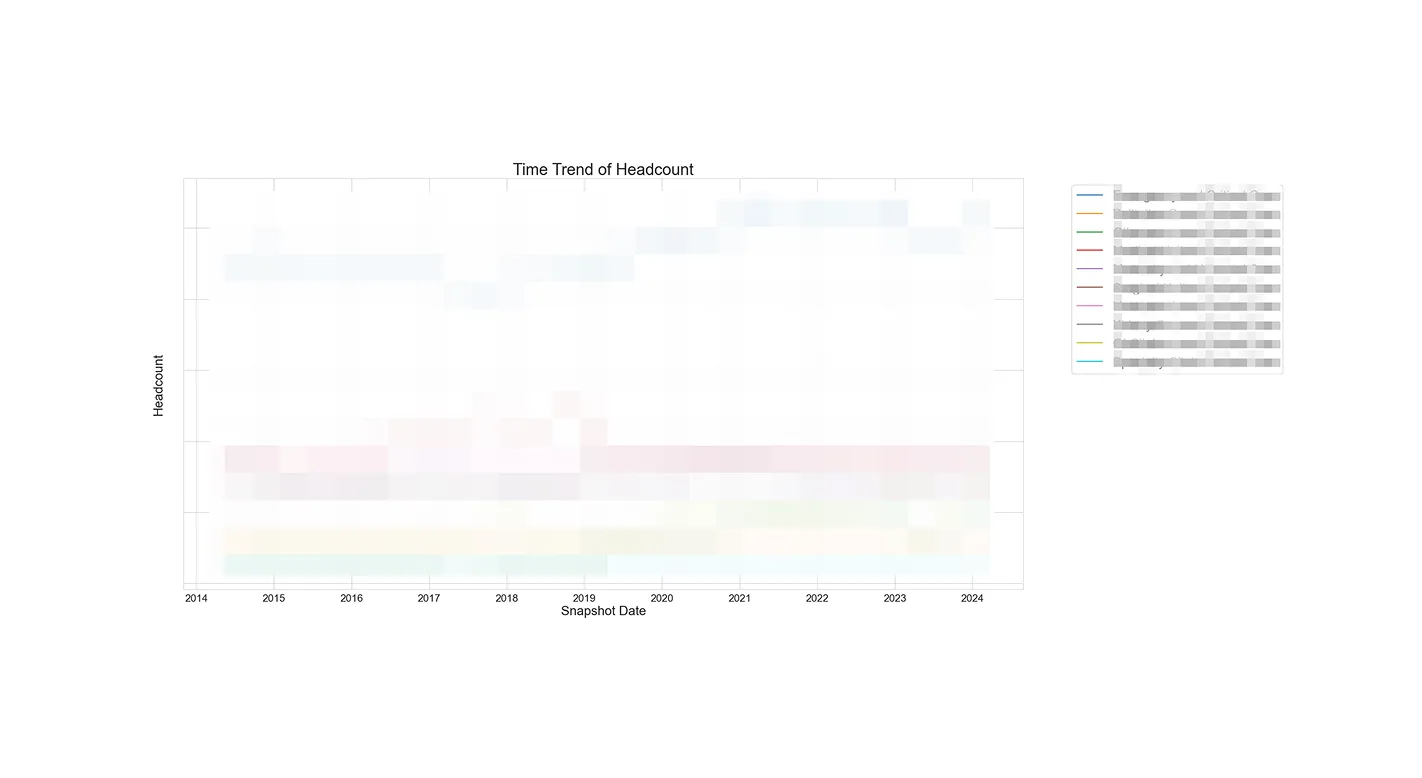
Service-Level Patterns
Diving deeper, we analyzed key metrics (like headcount, vacancy, and overtime) across individual service groups.
Unique trends shaped by external forces like the pandemic, allowing for more targeted planning and tailored interventions—all while maintaining confidentiality.
Unique trends shaped by external forces like the pandemic, allowing for more targeted planning and tailored interventions—all while maintaining confidentiality.
Models & Prediction
Our exploratory analysis revealed non-linear growth and seasonal patterns across services. Based on these trends, we selected two forecasting models for comparison: SARIMA and Meta Prophet.
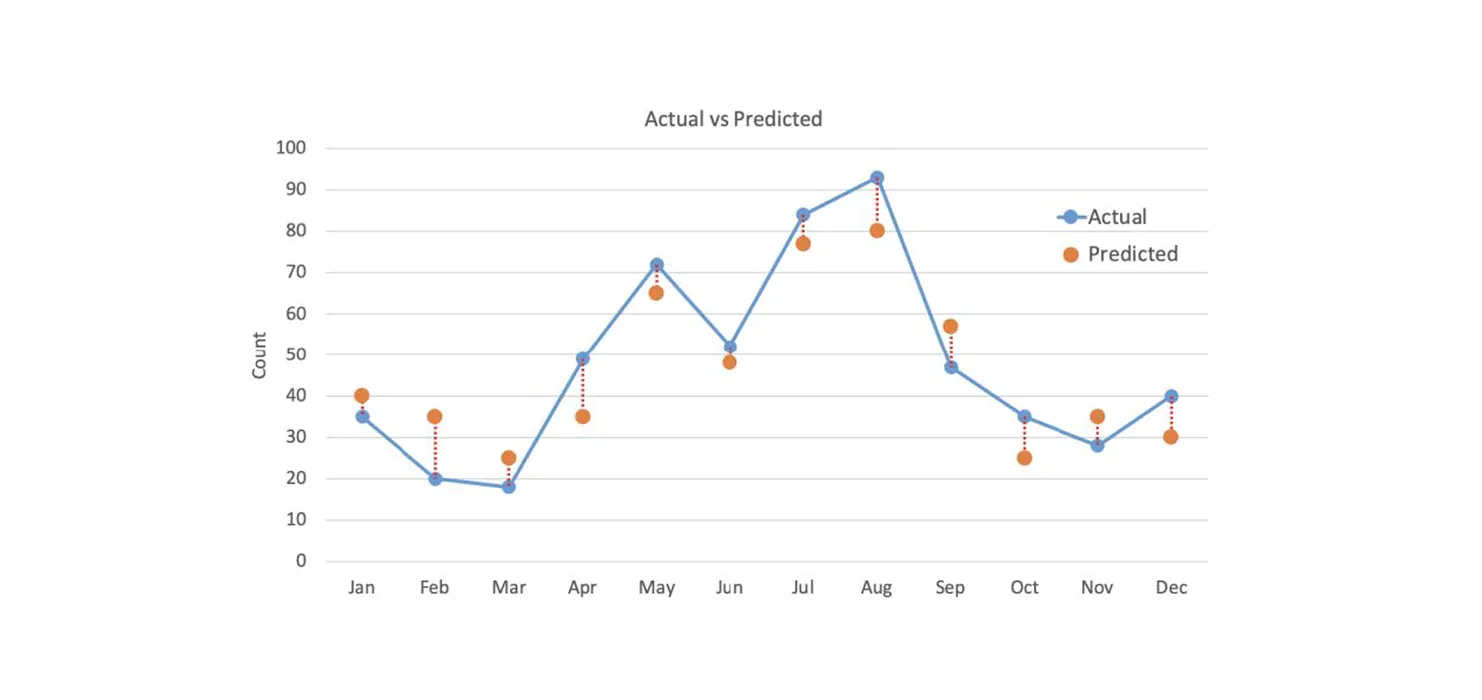
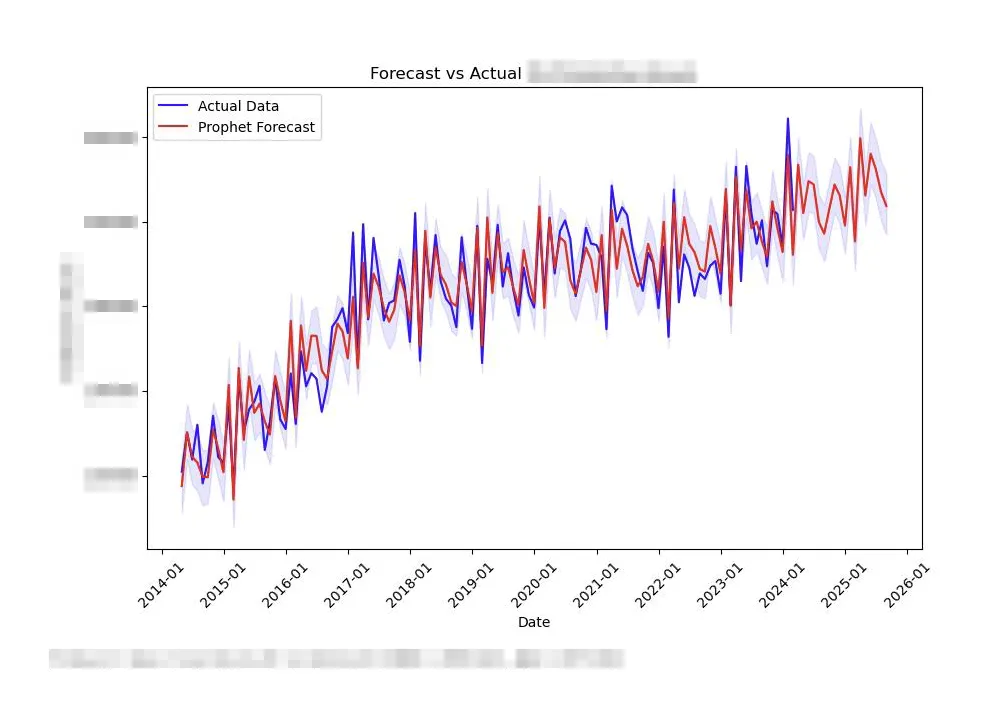
Evaluating Model Performance
To measure accuracy, we used Root Mean Square Error (RMSE) — a lower RMSE means better predictions.
In our evaluation chart:
🔵 Blue dots = actual values
🟠 Orange dots = predicted values
🔴 Red lines = errors between them
Evaluating Model Performance
To measure accuracy, we used Root Mean Square Error (RMSE) — a lower RMSE means better predictions.
In our evaluation chart:
🔵 Blue dots = actual values
🟠 Orange dots = predicted values
🔴 Red lines = errors between them
Model Insights
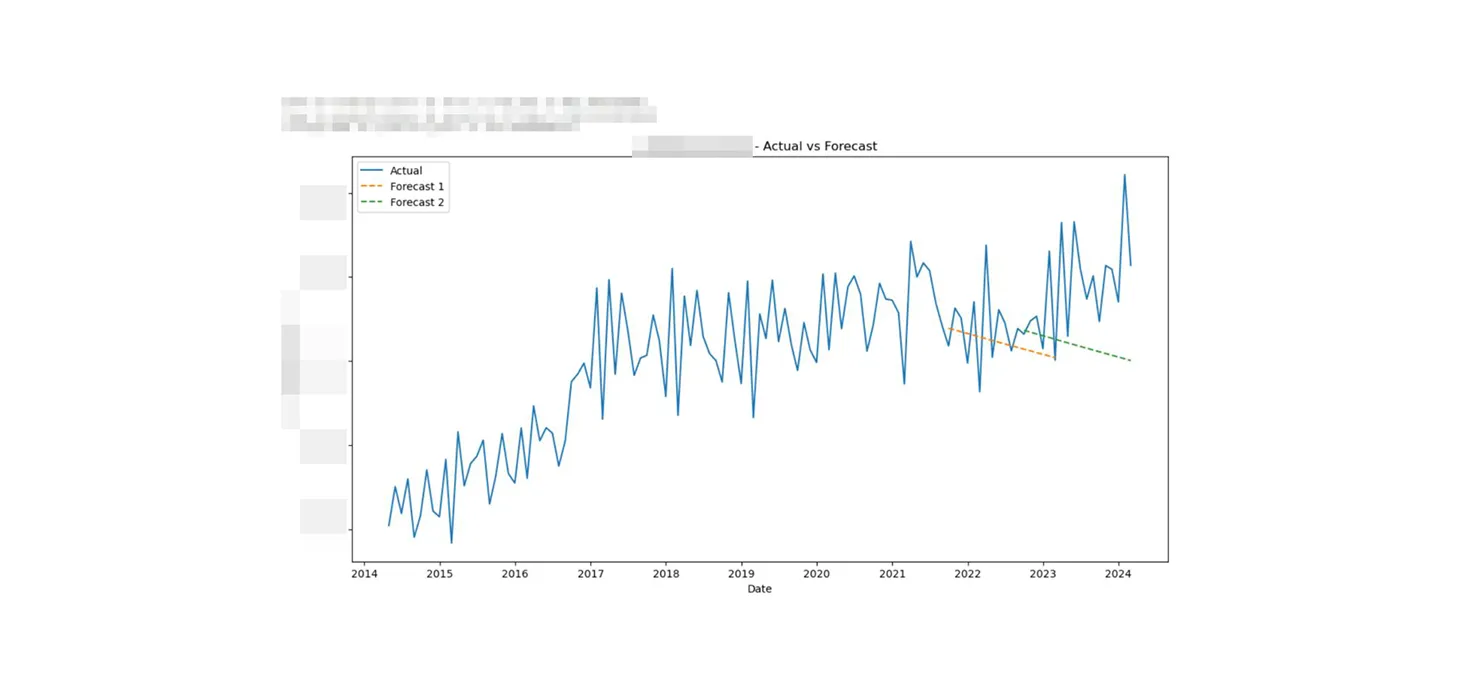
SARIMA
A time-series model that uses past data to forecast future values. However, with default settings, it produced flat predictions and failed to reflect key shifts in the data.
A time-series model that uses past data to forecast future values. However, with default settings, it produced flat predictions and failed to reflect key shifts in the data.
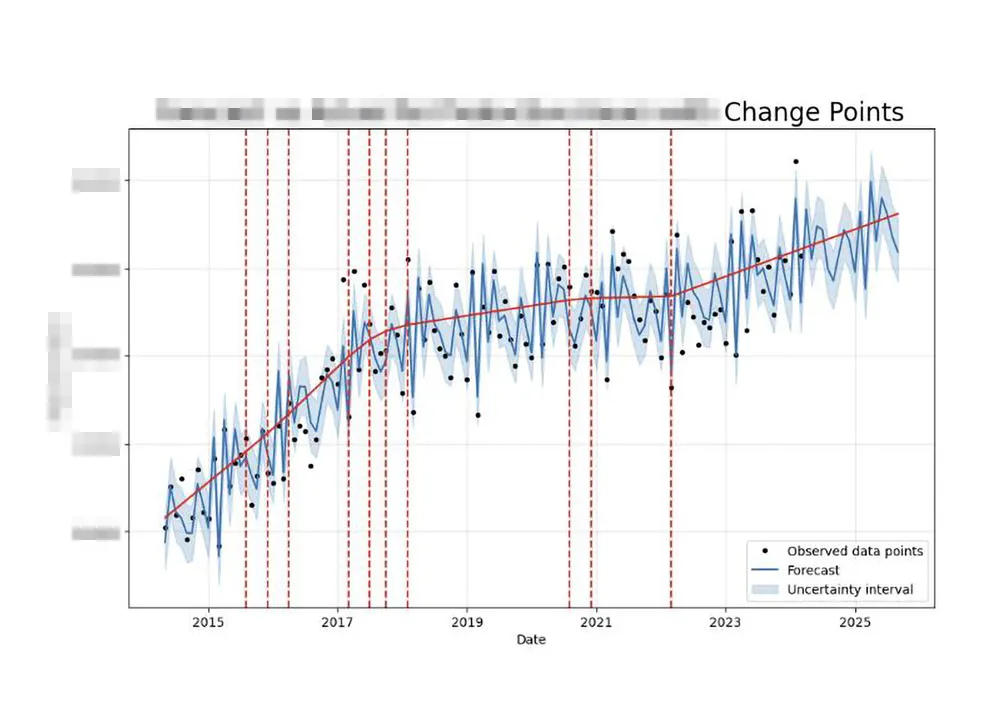
Meta Prophet
An open-source model built for trend and seasonality detection with minimal tuning.
An open-source model built for trend and seasonality detection with minimal tuning.
Key strengths:
- Change Point Detection: Adjusts for sudden growth shifts
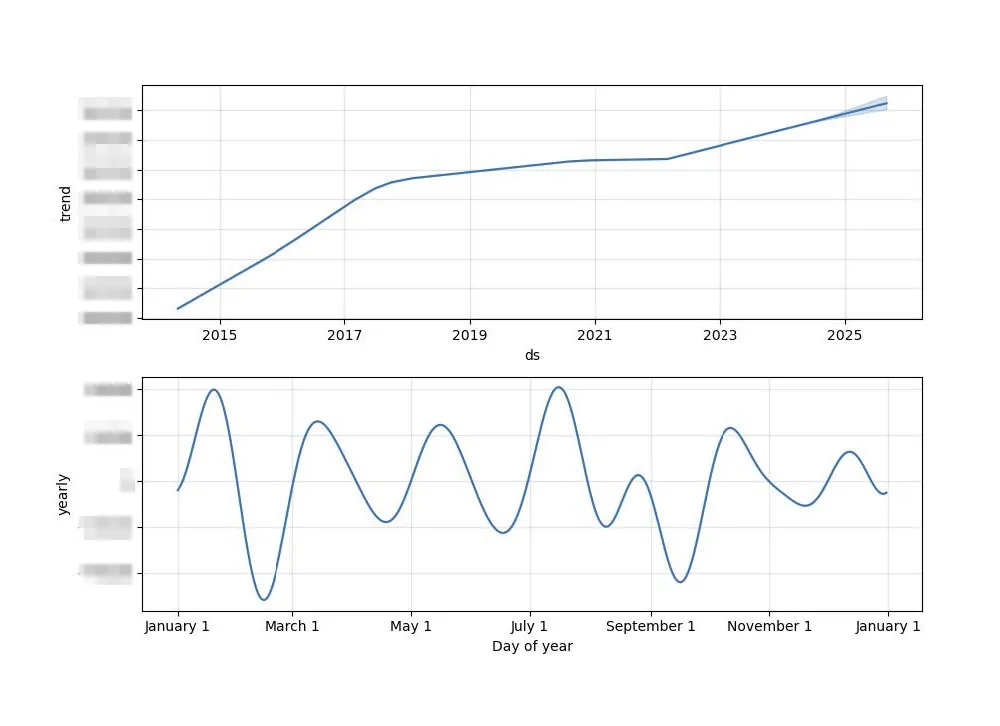
- Trend & Seasonality Decomposition: Breaks down long-term vs. cyclical patterns
- Performance Metrics: Evaluated via RMSE for accuracy and consistency
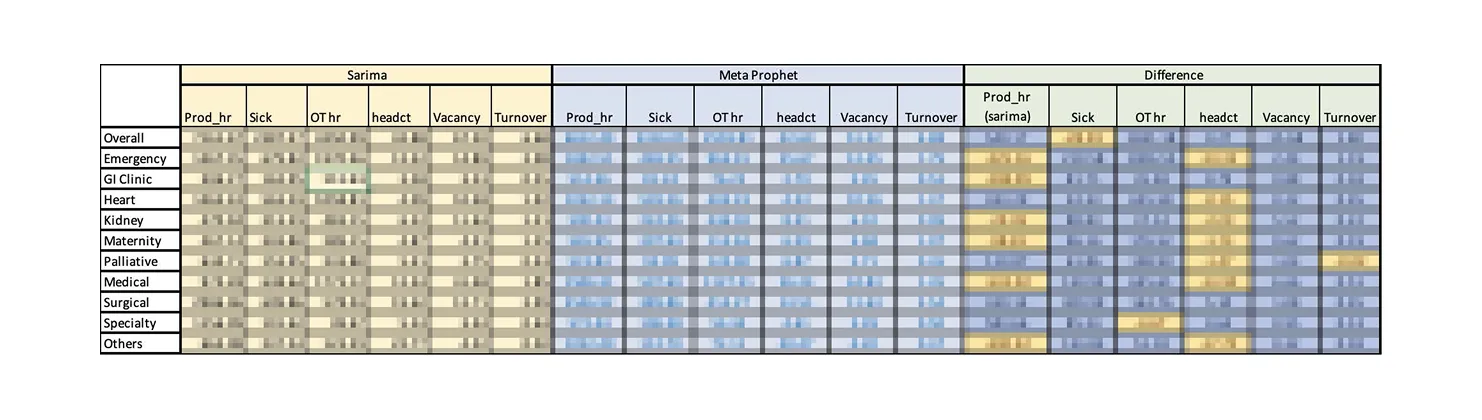
Model Comparison
We compared SARIMA and Prophet using February 2024 data.
Blue cells in the table highlight where Prophet outperformed SARIMA, handling complex patterns more effectively and delivering more accurate forecasts across services.
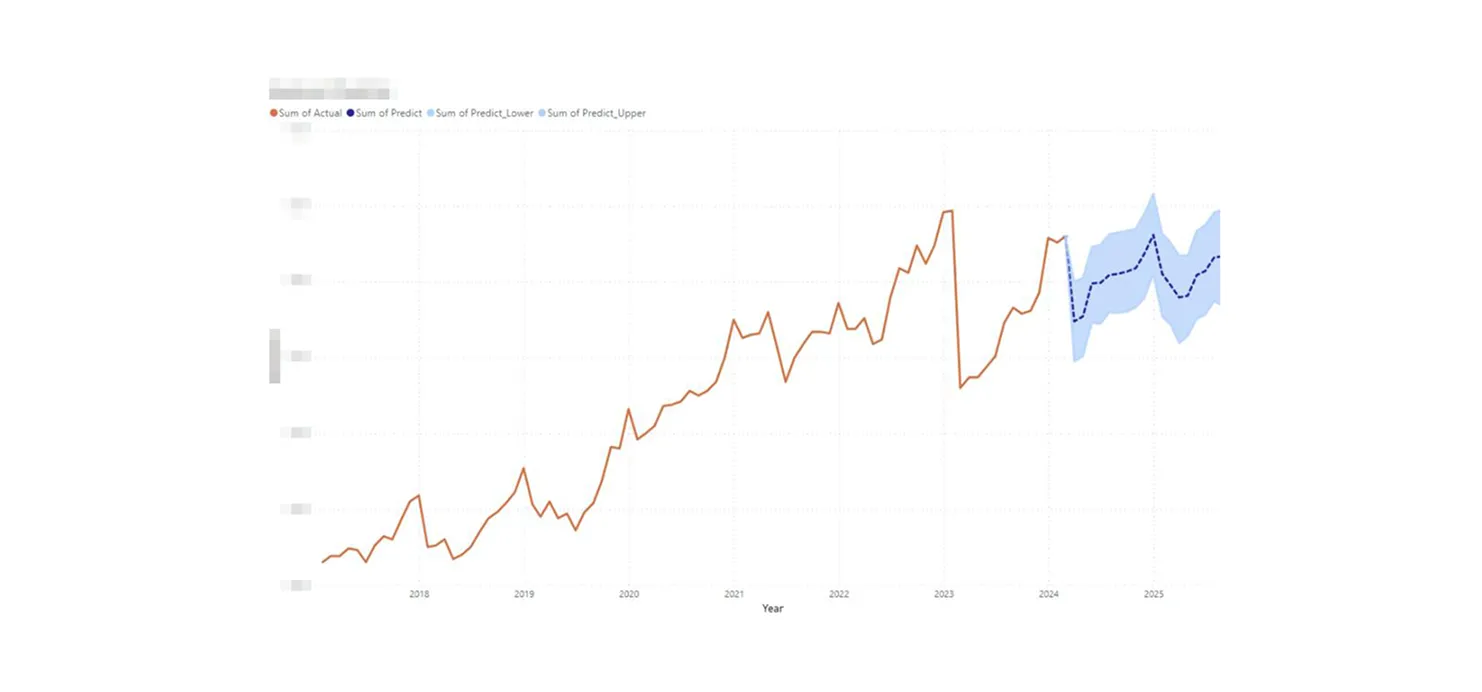
18-Month Workforce Forecast
Using Prophet, we forecasted staff movement across key HR metrics for 18 months starting March 2024.
These projections help:
These projections help:
- Spot staffing trends early
- Account for seasonal shifts
- Enable proactive, data-informed workforce planning
- Maintain confidentiality and adaptability in planning
Suggestions
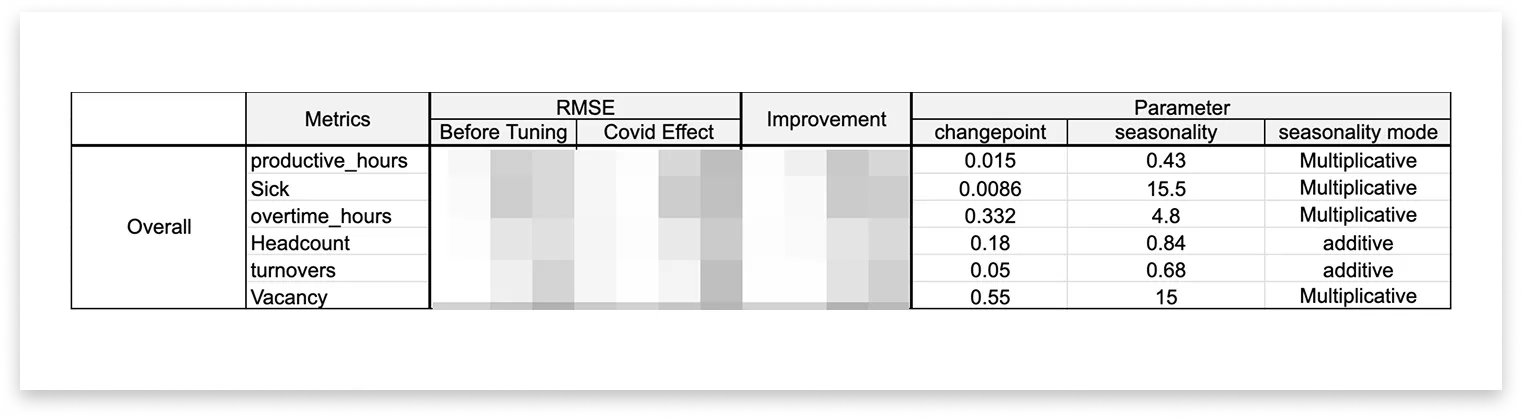
Model Adjustments
COVID-19 Lockdowns as Holiday Effects
- Treated lockdown periods as “holidays” to isolate one-time spikes and drops
- Enable proactive, data-informed workforce planning
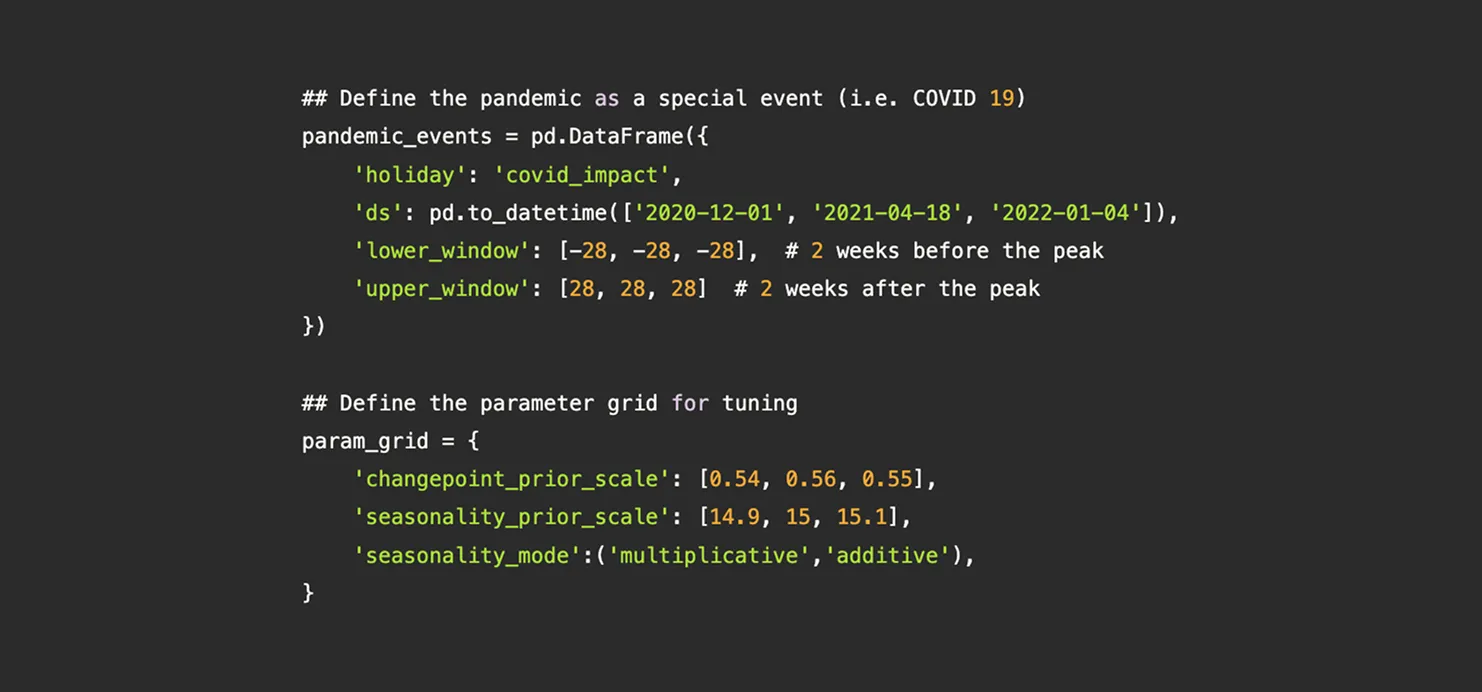
29%
Model accuracy improved
Data Enhancements
Metric Normalization
- Converted raw data into rates and ratios (e.g., turnover, overtime, sick leave)
- Enabled fair comparison across service groups
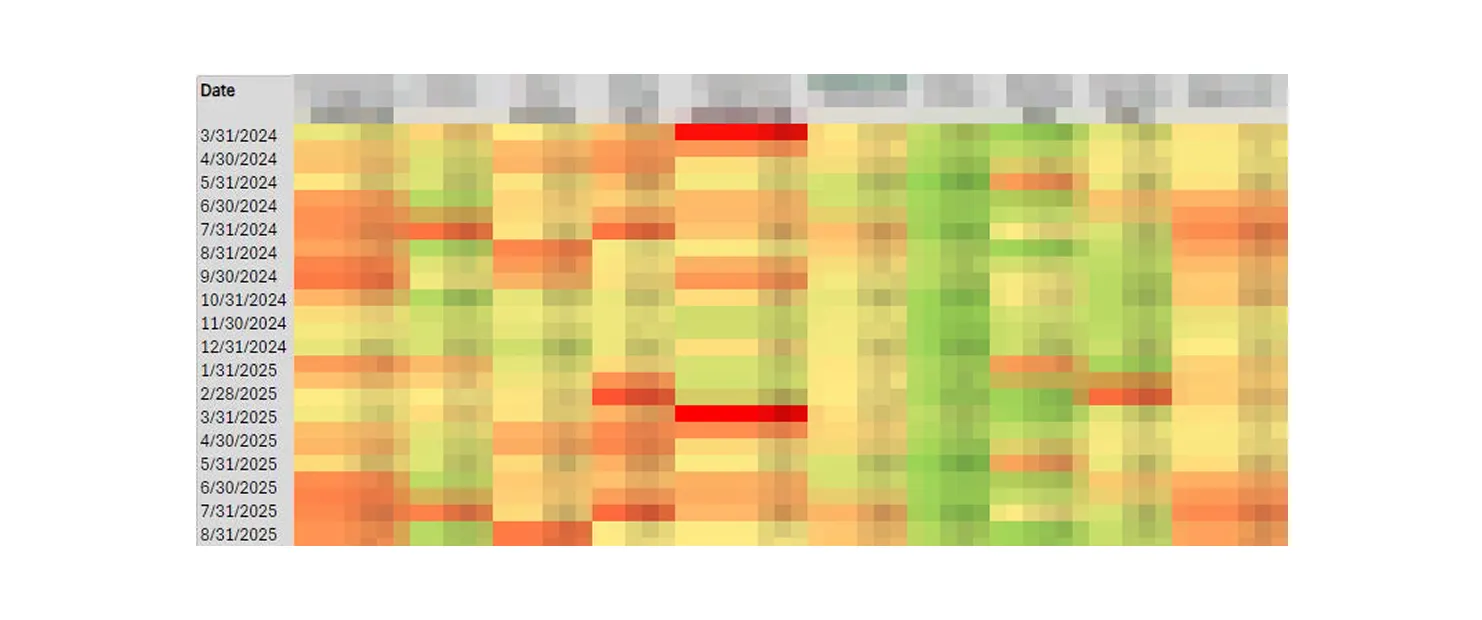
Heat Maps (18-Month Forecast)
- Identify high-risk areas: Dark/red zones = high rates
- Spot emerging trends: Visual shifts reveal seasonal patterns
- Actionable insights: Support proactive planning for retention, recruitment, and wellness
Workforce Warning System
A 3-tiered approach to detect and respond to staffing challenges:
Benchmarking & Thresholds
- Set data-driven thresholds using historical & industry data
- Compare across service lines to identify outliers
Early Alerts
- Compare across service lines to identify outliers
Strategic Planning
- Integrate metrics into long-term planning to forecast gaps and build resilience
Key Recommendations
Real-Time Workforce Dashboard
- Build a live dashboard with alerts for metrics crossing critical thresholds
Cross-Functional Task Force
- Form a team to respond to staffing issues and coordinate communication
Scenario Planning
- Use forecasting models to simulate scenarios (e.g., future pandemic waves)
- Refine contingency plans based on these projections
Targeted Recruitment & Retention
- Focus hiring on high-vacancy units
- Apply retention strategies to reduce turnover in critical areas
Model Refinement Loop
- Continuously improve predictions by feeding in new data and stakeholder feedback
Lessons
1. Applying the ML Cycle in a Real-World Setting
I gained hands-on experience using the full machine learning cycle to work with complex, large-scale datasets—while collaborating across roles. Each team member had a distinct responsibility, and aligning our tasks was key to delivering a cohesive solution.
2. Discovering Meta Prophet
One of the most exciting parts of this project was uncovering Meta Prophet—a tool we hadn’t been introduced to in school. It turned out to be incredibly powerful for time-series forecasting, with a wide range of parameters that allowed us to fine-tune our predictions.
3. Appreciating the Power (and Limits) of Hardware
Running models at scale, especially with heavy parameter tuning, introduced me to the practical reality of hardware limitations. Long processing times were a real challenge—and not something I had fully anticipated.
4. Communicating Insights Simply and Strategically
We had to present our findings to non-technical stakeholders, which pushed me to simplify complex concepts using clear language and real-world examples. More importantly, we turned data insights into actionable strategies, like recommending staffing adjustments for specific departments.
5. Understanding the Limits of Data
This project also revealed the realities of working with public-sector data: gaps, restrictions, and policy constraints that affect what can be collected—and how it can be analyzed. It reminded me that data can guide decisions, but it doesn’t tell the whole story.
